
Here’s a clear breakdown of Suzlon’s intraday chart and Suzlon Stock Price Movements for May 29, 2025, till 2:20 PM, explained in simple terms:
Key Snapshot (Image Explanation)
- Current Price: ₹65.55 (down 0.08% from yesterday’s close)
- Trading Range: ₹64.42 (low) to ₹68.00 (high)
- Volume Activity: 72,591 shares traded (average volume)
- Chart Pattern: The stock is drifting sideways near ₹65.50 after sharp swings earlier
Today’s Price Journey (Reasons Explained)
Phase 1: Early Surge & Profit-Booking (9:15-9:25 AM)
- Opened strong at ₹67.19 (up 1.3%) on results optimism
- Briefly hit ₹67.56 (+1.8%) as buyers rushed in
- Why it dropped: Early profit-taking by traders (volume spiked to 1.8M shares at 9:25 AM)
Phase 2: Sharp Sell-off (9:25-10:16 AM)
- Plunged to ₹64.93 (-2.1%)
- Key triggers:
- Panic selling after breaking below ₹66.50 support
- High volume (2.2M shares at 10:16 AM) confirmed bearish momentum
Phase 3: Sideways Struggle (10:30 AM-12:00 PM)
- Stuck between ₹64.75-65.20
- Why: Caution before results; low trading interest
Phase 4: Midday Recovery Attempt (12:00-1:48 PM)
- Jumped to ₹65.85 (+0.8%) on short-covering
- Short-covering = Traders who bet on falling prices bought back shares to avoid losses
- Fueled by technical buying near ₹65.00 support
Phase 5: Late Retreat (1:48-2:14 PM)
- Settled near ₹65.50
- Reason: Final profit-taking before results announcement

Why the Volatility?
- Results Anxiety: Investors overreacted to rumors about profit being ₹254Cr (bearish) vs. ₹444Cr (bullish)
- Technical Pressure:
- Resistance at ₹67.50 (earlier peak) capped gains
- Support at ₹65.00 prevented collapse
- Volume Clues:
- Spikes during sell-offs (panic)
- Thin volume in sideways moves (indecision)
Expert Takeaway
“This chart screams indecision. The wild swings show traders are gambling on results instead of investing. The real move happens tomorrow when we see if profits hit ₹444Cr (bullish) or ₹254Cr (bearish). Until then, ₹65 is the battleground.”
Key Levels to Watch:
- Upside Break: Above ₹67.50 signals rally
- Downside Risk: Below ₹64.40 could trigger panic
Remember: Today’s 3.8% swing range (₹64.40-67.56) is unusually high for Suzlon, proving how much is riding on tonight’s results!
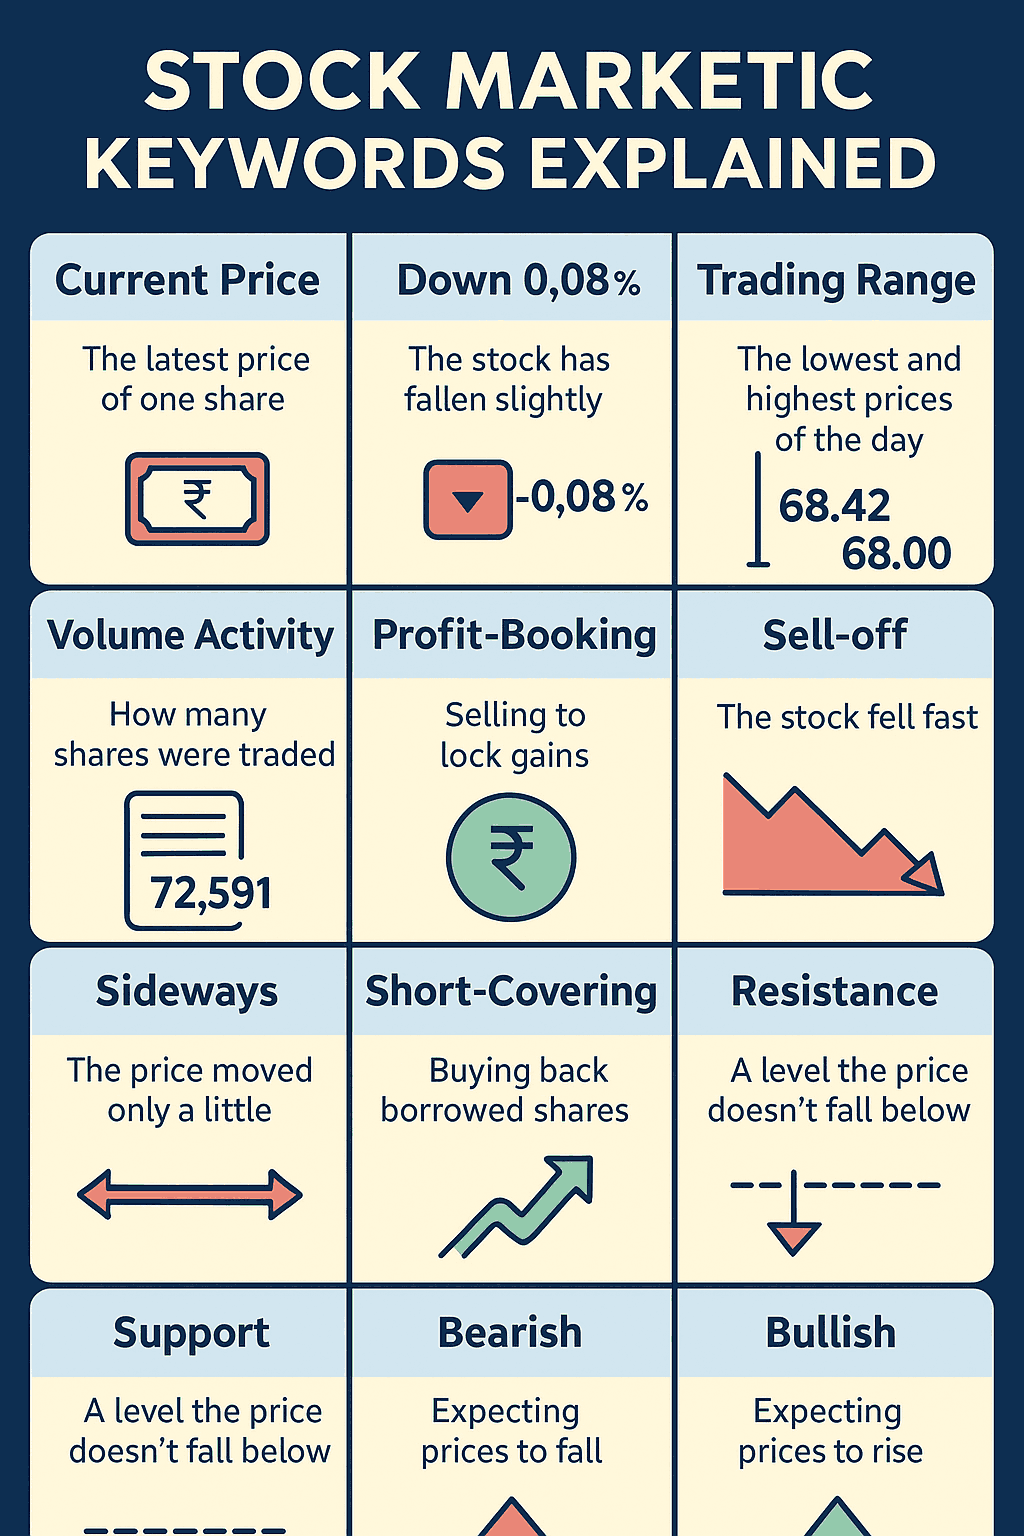
📘 Stock Market Keywords Used In The Article Explained
1. Current Price
- This is the latest price of one share of Suzlon.
- 💡 Example: If Suzlon’s current price is ₹65.55, that means if you want to buy 1 share right now, it’ll cost you ₹65.55.
2. Down 0.08%
- This means the stock has fallen slightly compared to yesterday’s price.
- 💡 Example: If yesterday’s price was ₹65.60 and today it’s ₹65.55, it dropped by 0.08%.
3. Trading Range
- This shows the lowest and highest prices the stock hit during the day.
- 💡 Example: Suzlon moved between ₹64.42 (low) and ₹68.00 (high) — like a rollercoaster!
. Volume Activity / Shares Traded
- Volume = how many shares were bought and sold.
- 💡 Example: If volume is 72,591, that means 72,591 Suzlon shares changed hands today.
- 🔍 A very high volume usually means something important or exciting is happening.
5. Intraday Chart
- This is a graph that shows how the stock price moved during the day, minute by minute.
6. Resistance
- A price level where the stock struggles to go above.
- 💡 Example: ₹67.50 was a resistance for Suzlon — when the price reached it, sellers came in and pushed it down.
7. Support
- A price level where the stock usually doesn’t fall below — buyers step in.
- 💡 Example: ₹65.00 was support — it stopped the fall during panic selling.
8. Bearish / Bullish
- Bearish = People expect prices to fall.
- Bullish = People expect prices to rise.
- 💡 Example: If people think profits will be ₹254 Cr (lower), that’s bearish. But if it’s ₹444 Cr (higher), that’s bullish!
9. Volatility
- Big ups and downs in price — means uncertainty or nervousness.
- 💡 Example: A swing of ₹64.40 to ₹67.56 in one day is high volatility — not normal for Suzlon!
10. Spikes in Volume
- A sudden jump in the number of shares traded.
- 💡 Example: 2.2 million shares traded during panic selling — that’s a volume spike.
The full proper analysis will be published at 10 PM today. Keep tuned!

![₹444Cr or ₹254Cr? Suzlon’s Q4 Profit [2025] Puzzle Revealed Today](https://sharebaz.com/wp-content/uploads/2025/05/Add-a-heading-4_11zon-1024x576.png)


Leave a Comment